For two years, I sat on the board of the NY Entrepreneurs’ Organization as the Head of Member Engagement. At my first board meeting, I asked the group for some prior data on member engagement. My aim was to find a baseline level of engagement which I could use to build goals for the future. After I asked the question, all the more experienced members turned their heads towards the chapter administrator, Beth, and said she has the data. With excitement, I asked where she keeps the data and if I could see it? Another senior member jumped in laughing and said, “It would be rather hard to see because it’s all in her head.”
As it turns out, most organizations and teams have very little hard-lined data on engagement. Most are relying on guesses and/or the general knowledge of one or two people. Tactics like this can work for smaller teams, but once you are dealing with more than 50 people, it’s time to formalize the process and build an Engagement Dashboard.
Here are some keys to building out an Engagement Dashboard for your organization:
- K.I.S.S. – Keep it stupidly simple! Don’t over-complicate something that doesn’t need to be overly complicated. Make tracking data as simple as possible. Keeping your Engagement Dashboard straightforward will ensure that you will actually set it up and use it.
- Culture Specific – Every culture will have different metrics to track engagement. Some examples are: meeting attendance, leadership positions held, time given to various projects, or even comments made. Pick a few actions to track that make the most sense for the culture you want to build.
- Follow Dance Floor Theory – Through the DFT Engagement System, we give you a very simple way to label your various engagement levels. In our company, we use the labels SKN, SK1, SK2, SK3, SK4, and SK5 to represent the various levels of engagement of our people.
- Progress over Perfection – Don’t let “perfect” stop you from making progress. Make the first version of your engagement dashboard as simple as possible. This way, you can get things going and start to see a visual map of each member’s engagement in your organization, as well as the overall engagement level.
I spent the first two months as Head of Member Engagement creating a measurable dashboard to better track the engagement of our members. At the time, I used a simple Google Spreadsheet, and a lot of elbow grease, to get it done.
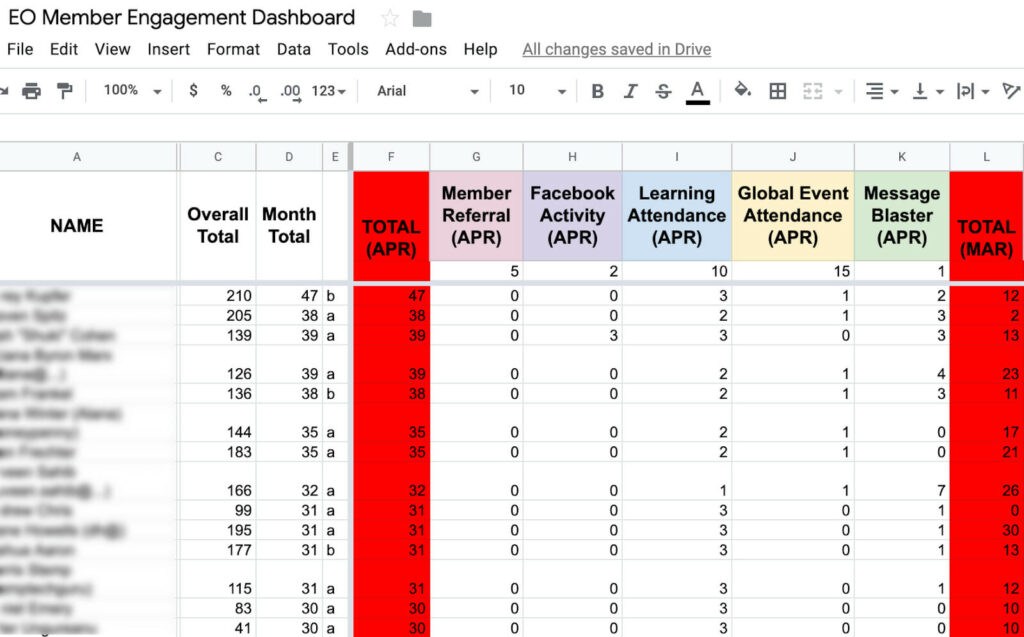
Over the next two months, as we filled in tracking data, a beautiful visual graph of the organization’s engagement became clearer and clearer.
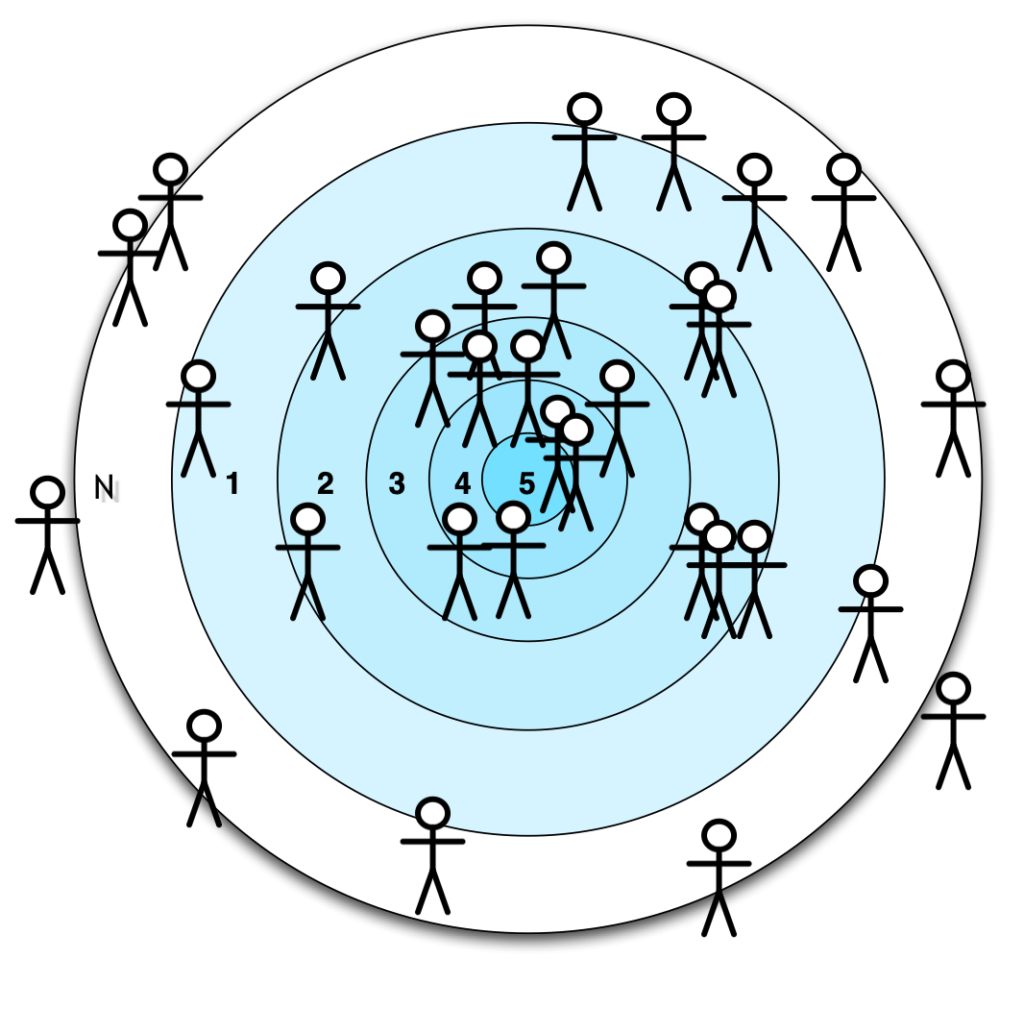
Having real data and a visual graph, we were then able to quickly see an engagement breakdown of the members, based on the DFT Engagement System:
EOn – 7% of members
EO1 – 4%
EO2 – 40%
EO3 – 31%
EO4 – 11%
EO5 – 7%
We even knew the names of the members at each level, so we were able to connect with them at their level of engagement. Remember, the “one-size-fits-all” approach to engagement no longer works. We were also able to see which members were EO1 and EOn, and thus most likely not to renew their membership. This Engagement Dashboard became a very powerful tool for member retention.
While working with College of Dupage on their student engagement, our main contact mentioned to me how amazing it was that they had hard data. The numbers proved that students who went to certain activities, like new student orientation, had an increase in retention of 77% over people who didn’t go. I pushed back a little, knowing that there are a ton of factors related to retention, besides just going to one event. She acknowledged the truth, but replied that no one else was tracking anything, so this was her starting point and she would improve it over time.
Remember, ‘progress over perfection’ is the key when it comes to building out your own Engagement Dashboard.
